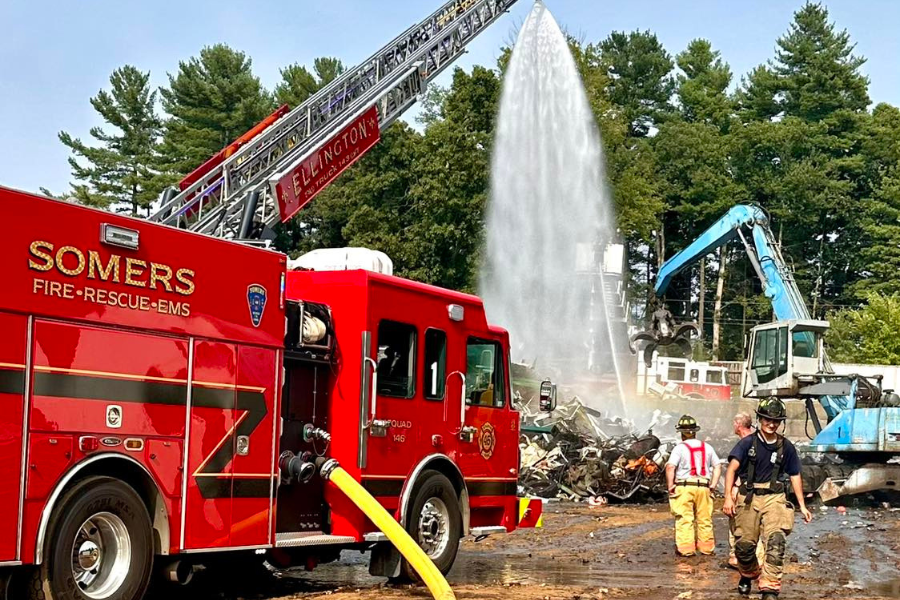
Below are our call statistics from 2000 through 2023. Please note the rapid increase and decrease of calls for service in 2011. This was due to numerous significant weather events. Medical calls account for a large majority of our incidents; however, all incidents increase from year to year.

| Year | Building Fires | Other Fire/Alarms | Motor Vehicle Accident | Medical | Service/Weather Hazard | Total |
| 2024 | 6 | 28 | 36 | 1,048 | 1 | 1,461 |
| 2023 | 22 | 135 | 85 | 1733 | 257 | 2449 |
| 2022 | 12 | 259 | 73 | 2117 | 150 | 2611 |
| 2021 | 13 | 247 | 68 | 1859 | 215 | 2402 |
| 2020 | 14 | 205 | 49 | 1681 | 193 | 2142 |
| 2019 | 13 | 213 | 83 | 1184 | 144 | 1637 |
| 2018 | 12 | 197 | 55 | 886 | 112 | 1262 |
| 2017 | 15 | 194 | 75 | 888 | 125 | 1297 |
| 2016 | 16 | 194 | 73 | 788 | 119 | 1191 |
| 2015 | 13 | 178 | 87 | 716 | 109 | 1103 |
| 2014 | 4 | 146 | 84 | 609 | 109 | 952 |
| 2013 | 14 | 128 | 85 | 607 | 139 | 973 |
| 2012 | 14 | 125 | 75 | 568 | 202 | 984 |
| 2011 | 12 | 149 | 81 | 592 | 446 | 1280 |
| 2010 | 8 | 144 | 94 | 531 | 212 | 989 |
| 2009 | 6 | 116 | 95 | 540 | 143 | 900 |
| 2008 | 9 | 133 | 100 | 441 | 214 | 897 |
| 2007 | 8 | 146 | 99 | 426 | 186 | 865 |
| 2006 | 8 | 138 | 110 | 409 | 187 | 852 |
| 2005 | 3 | 140 | 136 | 361 | 275 | 915 |
| 2004 | 8 | 136 | 95 | 345 | 156 | 740 |
| 2003 | 6 | 110 | 4 | 374 | 145 | 682 |
| 2002 | 12 | 117 | 56 | 345 | 112 | 642 |
| 2001 | 3 | 142 | 66 | 367 | 88 | 666 |
| 2000 | 17 | 131 | 127 | 344 | 107 | 726 |
